
Twice a year, Nielsen pulls back the curtain on what America has actually been watching. The numbers for the first half of the year have just landed, and it is quite nice to see so many original shows doing so well. Stranger Things and The Pitt are duking it out at the top, sure, that part tracks. But shows like One Piece, Invincible, and Shrinking also have a healthy viewership and have made it into the Top 20 Most-Watched Originals for the Year.
Kids still are the biggest market for streaming, though, as Bluey has outdone Grey’s Anatomy. Meanwhile, The Big Bang Theory is having a renaissance with both the original show and Young Sheldon outperforming Modern Family and Friends. Without taking forever to break down what the Nielsen charts for the first half of the year are telling us about TV and streaming, let’s get started.
It is worth noting that Nielsen ranks these by total minutes viewed, which means shows with larger episode libraries naturally have an advantage; Nielsen itself separates originals, acquired titles, and movies for that reason.
Most-Watched Original Series of 2026 by Streaming Service
Looking only at the Original Series chart, the biggest original from each streaming service is:
- Netflix: Stranger Things, 23.261 billion minutes
- HBO Max: The Pitt, 21.118 billion minutes
- Paramount+: Landman, 12.400 billion minutes
- Prime Video: The Boys, 9.597 billion minutes
- Peacock: The Traitors, 7.737 billion minutes
- Hulu: Paradise, 5.660 billion minutes
- Apple TV+: Shrinking, 5.246 billion minutes.
Disney+ does not have an Original Series in the Top 20, which is worth highlighting given the streamer’s size and the fact that it has aired shows like Percy Jackson, Daredevil: Born Again, Star Wars: Maul – Shadow Lord, and Wonder Man already this year. None of these shows managed to break into the Top 10 on the Nielsen Weekly charts either.
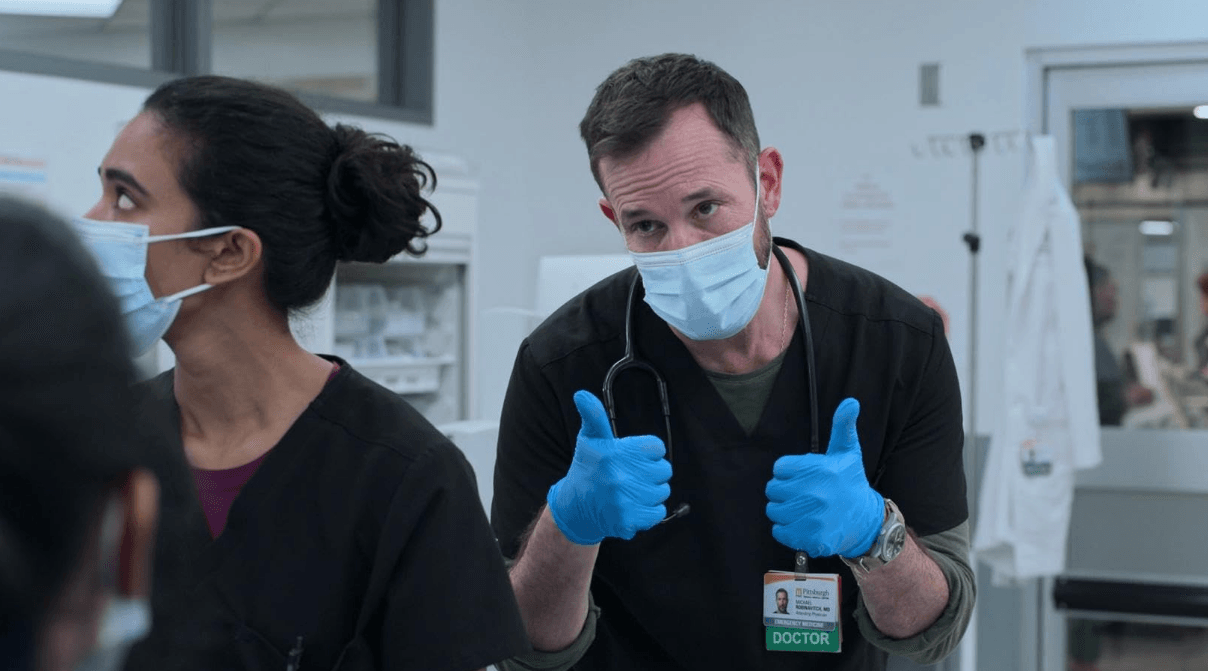
Stranger Things, with 23.261 billion minutes of watchtime, has been the Most-Watched TV Show of 2026 so far in the United States, followed closely by The Pitt at 21.118 billion minutes. The kind of numbers The Pitt has managed to pull off is truly remarkable, especially given that the show is only in its second year and has aired just 30 episodes so far, compared to Stranger Things’ 42.
If every minute watched of The Pitt belonged only to Season 2 (which has a total runtime of 717 minutes), Nielsen’s 21.118 billion minutes would equal roughly 29.5 million complete Season 2 binges.
If viewers watched both seasons together (which brings the series’ total runtime so far to 1,444 minutes), that same viewing total represents about 14.6 million complete series binges. Figures that are absolutely astonishing, no matter how you look at them.
Most-Watched Acquired TV Shows of 2026
The most-watched acquired show of 2026 so far is Stranger Things’ biggest competitor this year, and is likely to sit at the top comfortably by the time the year comes to a close.
Bluey is the biggest thing to have come out of Queensland since Margot Robbie and has been the go-to show for kids over the last few years. The beloved ABC cartoon about a Blue Heeler puppy and his family shows no signs of slowing down, having racked up over 22.8 billion viewing minutes in the United States in the first half of 2026.
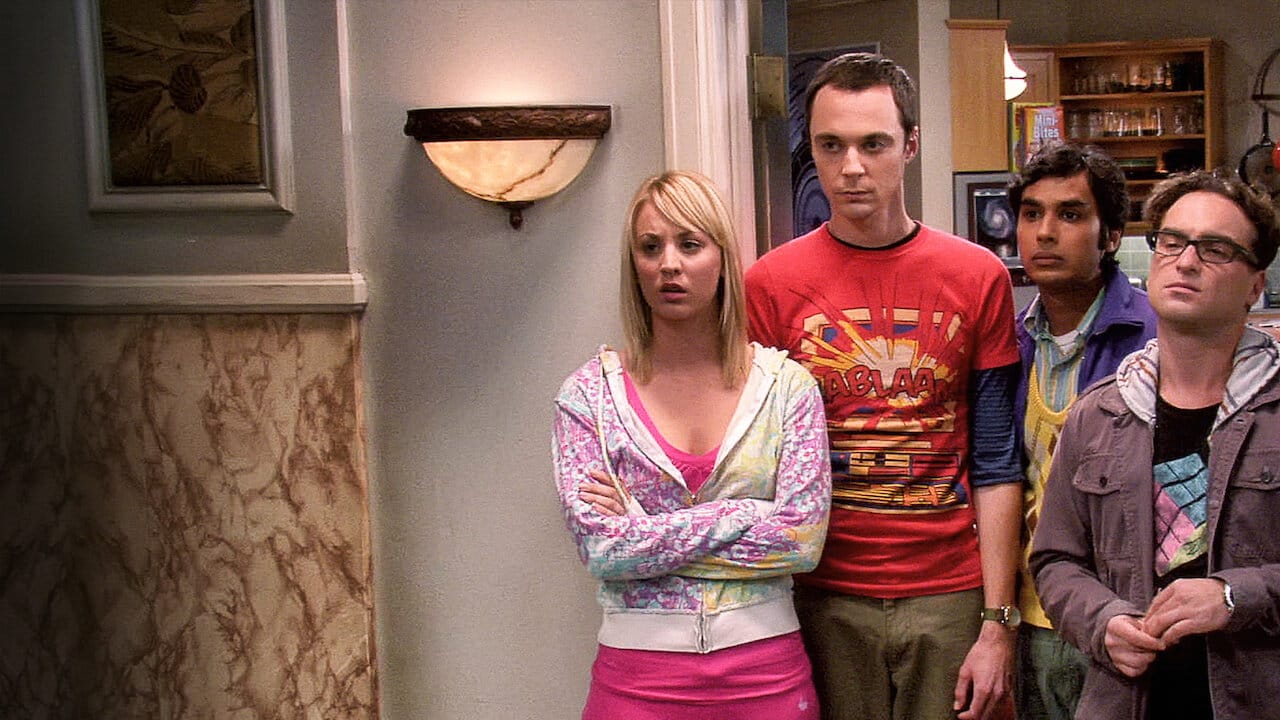
Meanwhile, Grey’s Anatomy was viewed for 20.414 billion minutes across 467 episodes and is the most-watched acquired drama series of 2026 so far. The most-watched comedy is The Big Bang Theory, with 20.404 billion viewing minutes. The Chuck Lorre CBS sitcom’s numbers are quite staggering once you factor in the fact that it managed this with 281 episodes, 186 fewer than Grey’s Anatomy needed to get almost exactly the same numbers, and that is before we point out that its episodes are half the length of the ABC medical drama.
The other major live-action non-scripted acquired hits are:
- NCIS — 11.870B minutes
- Law & Order — 11.387B
- The Closer — 11.346B
- Young Sheldon — 10.905B
- Friends — 10.560B
- Modern Family — 9.765B
While the biggest animated titles on the Acquired chart are:
- Bluey — 22.809 billion minutes
- SpongeBob SquarePants — 16.894 billion minutes
- Family Guy — 15.957 billion minutes
- Bob’s Burgers — 15.013 billion minutes
- Paw Patrol — 13.559 billion minutes
One of the biggest takeaways from this entire list is that animation and kids’ programming have continued to reign supreme. Bluey sits above every single acquired live-action series on the chart. SpongeBob, Family Guy, and Bob’s Burgers aren’t far behind either, all comfortably sitting over some of the biggest shows television has ever produced.
All this makes Disney’s own absence from this conversation almost funny in how avoidable it is. They created a streaming service to produce big IP shows from Marvel and Star Wars. They have not only been chasing viewership but have also been chasing award prestige with these shows. Now, both the award buzz and the viewership for these shows have well and truly dried up, and the oversaturation of Star Wars and Marvel stuff has hurt their main product, which has always been movies.
The two Disney+ shows that did manage to rank are Bluey (acquired) and The Simpsons. Who knew that the studio most popular for doing cartoons’ biggest-selling point in TV has remained animation, despite spending billions on Boba Fett something?
Source: Nielsen.